
Digital Terrain Models
Understand your terrain with bare earth DEMs (digital elevation models) or DSMs (digital surface models).

Cost effective aerial LiDAR point clouds for Australian businesses.

Our pilots are trusted by leading organisations.
Make measured decisions.
Advances in aerial LiDAR technology have made drone LiDAR a practical substitute for previously costly LiDAR acquisition. Projects that were previously too "niche" to justify the costs are now cost effective.
Understand your terrain with bare earth DEMs (digital elevation models) or DSMs (digital surface models).

Show the shape of terrain & features by "slicing" point cloud across any surface.

Assessing variations in soil surface to understand erosion patterns.

Quantitative mapping of vegetation, to assess plant heights & spread.

Calculate slopes' grades and aspect and contour lines from point cloud elevation data.

Calculate volumes to assist with project planning or water storage estimations.

Watershed and predictive water flow modeling based on lidar-derived data.

Extract buildings, power lines, roads, and other infrastructure features from point cloud data for detailed site analysis.

Automated classification of point cloud data into categories like ground, vegetation, buildings, and power lines for advanced analysis.
Accuracy above everything.
Rich datasets for valuable insights
Our drone LiDAR technology transforms complex sites into actionable 3D models through precise point cloud capture. Each dataset provides comprehensive site information at a fraction of traditional survey costs, making advanced mapping accessible for projects of any size.
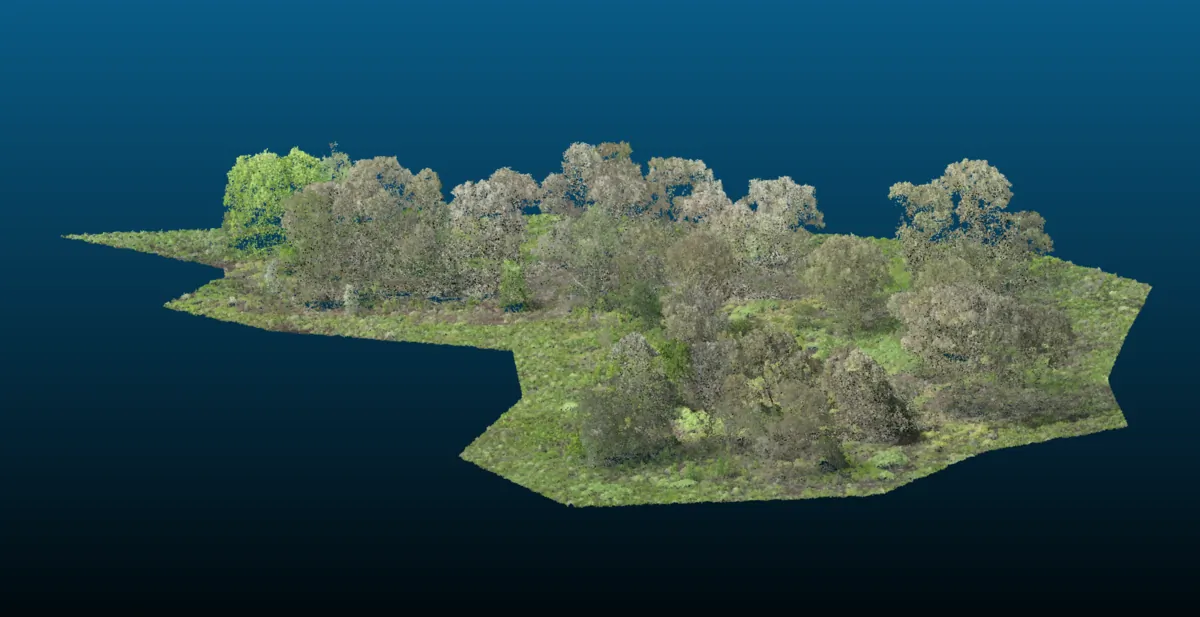
Each point is assigned true color values captured by the onboard high-resolution camera, creating a photorealistic 3D representation of the scanned environment.
Each point is assigned true color values captured by the onboard high-resolution camera, creating a photorealistic 3D representation of the scanned environment.
Points are colored based on their capture time using GPS week seconds, enabling identification of flight line overlaps and temporal patterns in the data collection process.
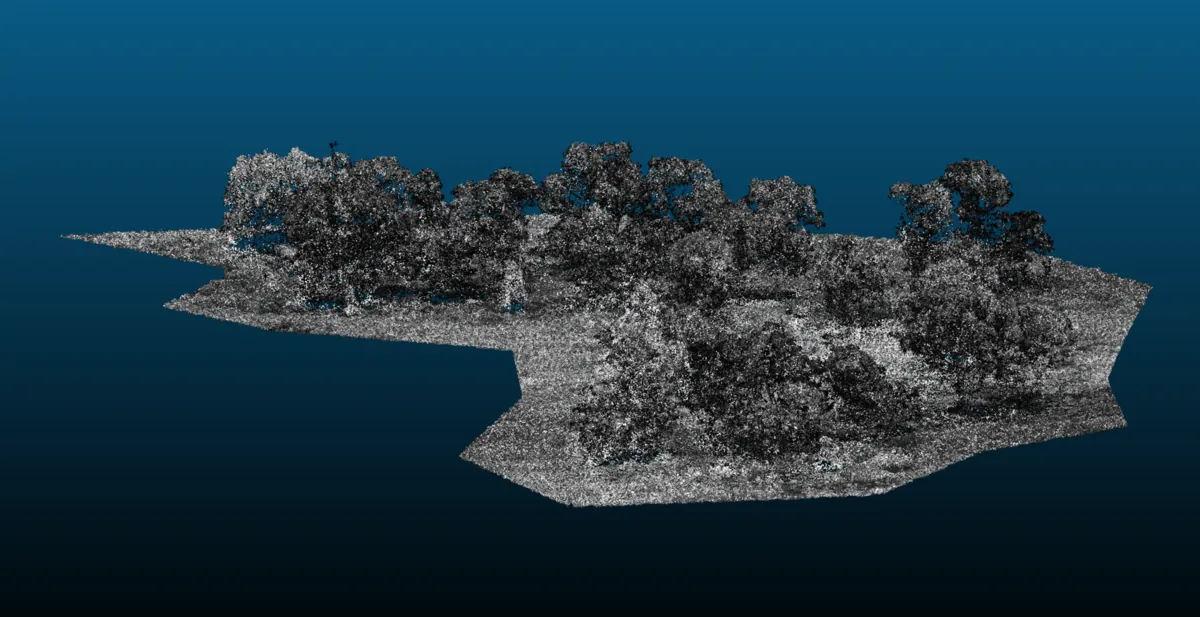
Displays the strength of the returned laser signal for each point, providing insights into surface reflectivity and material properties. Useful for detecting features like road markings and material boundaries.
Indicates which return the point represents from a single laser pulse, crucial for understanding vegetation structure and penetration through canopy layers.
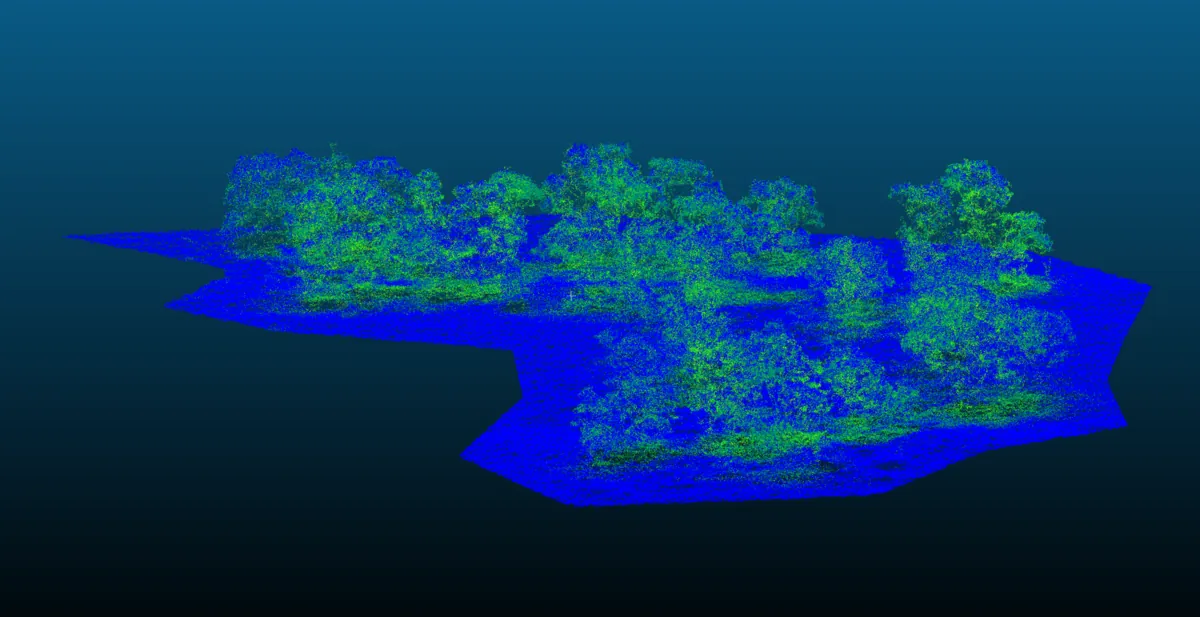
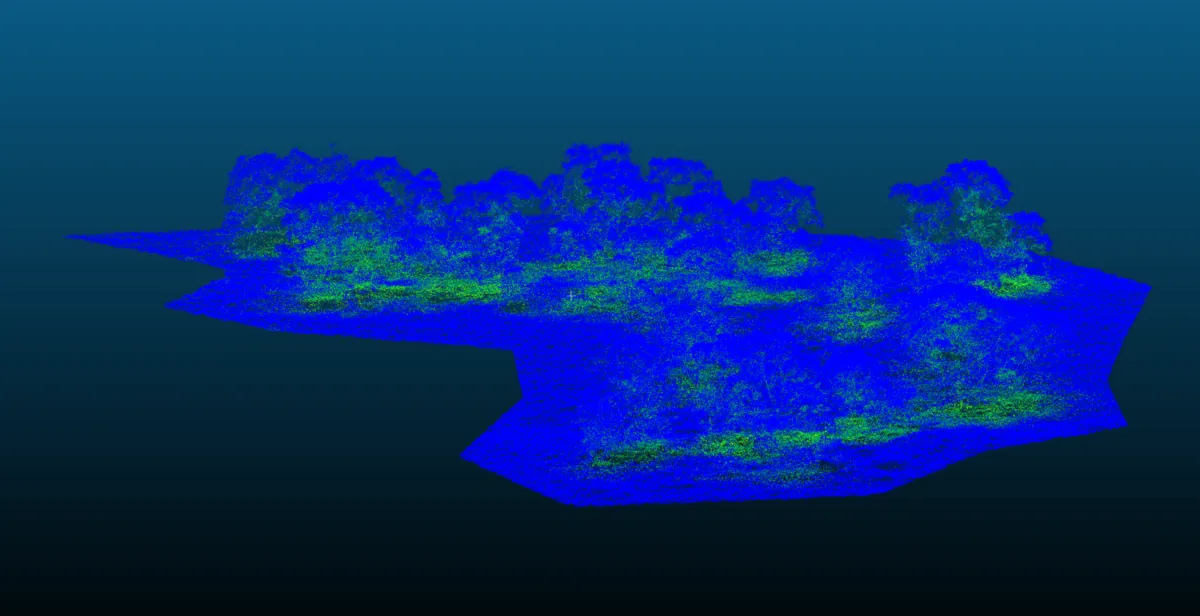
Shows how many returns were detected from each emitted laser pulse, providing information about the complexity and density of vegetation or structures along the beam path.

Represents the angle between the laser beam and the vertical axis at the time of measurement, helping identify potential data quality variations and coverage patterns.
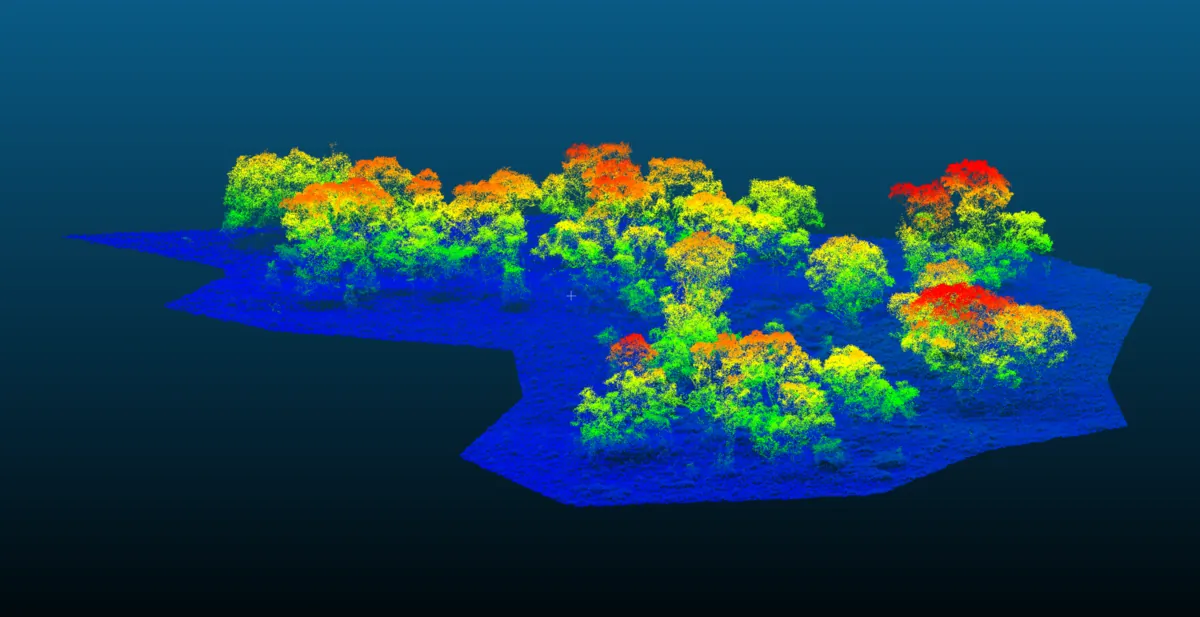
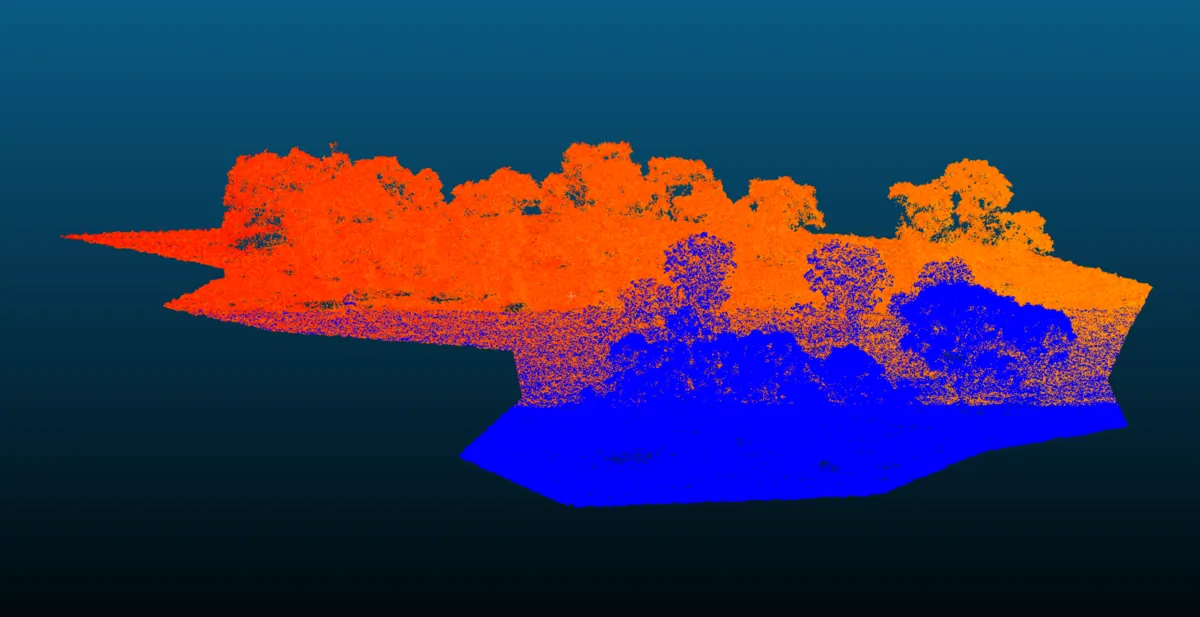
Visualizes the relative elevation of each point above the classified ground surface, essential for measuring object heights and analyzing vertical structure distribution.
Our pilots are trusted by leading organisations.
Experience you can trust.
Our pilots have experience capturing high quality data in challenging conditions. From the remote center of arid Australia to the dense tropics of Far North Queensland, we know how to get reliable data in an efficient manner.

How it works
Simple steps to get your drone project done right
Tell us what you need and we will plan the best approach. We coordinate logistics and prepare a detailed mission plan for your project.
Whether by road or plane, we can reach remote locations across Australia with the equipment and personel to get your job done.
We fly the drone and collect the data you need. Following best practices to ensure best possible data quality and safety.
We turn the raw data into useful information. Our team ensures all deliverables meet your project requirements.
We provide your data in the format you need. Everything is quality checked and ready for use.
Take the hard work out of drone fleet management. Start capturing the data needed to make your business soar.